


In this series of blog posts, we discuss Core Web Vitals, its metrics, useful tools and concrete actions to improve them.
To start with, we will summarise the process for determining the thresholds for Core Web Vitals metrics in general. Then we will discuss the specific criteria used to set the thresholds for each Core Web Vitals metrics in our 2nd blog post. In the third blog post, we will discuss a set of tools to measure Core Web Vitals. In our last post, we will assess tactics and actions to improve them.
What are Core Web Vitals?
It is an initiative by Google to provide guidance on the quality of websites and Ecommerce sites and how they will affect the user experience.
Read this great post https://web.dev/vitals for all details.
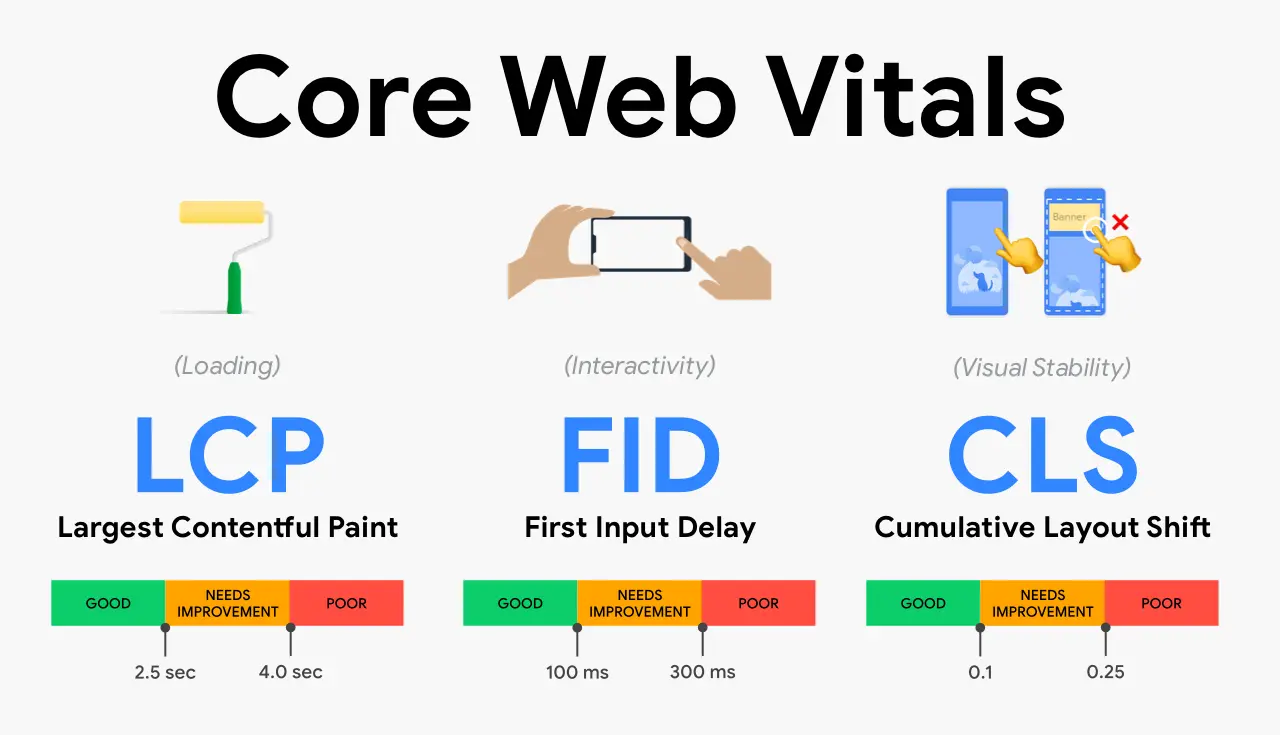
In short. Core Web Vitals are a subset of Web Vitals that apply to all web pages. There are 3 key metrics:
- Largest Contentful Paint or LCP - measures loading performance
- First Input Delay or FID - measures interactivity
- Cumulative Layout Shift or CLS - measures visual stability
Core Web Vitals was introduced in February 2022 for desktop rankings. It was announced by Google in November 2021.
Core Web Vitals Metrics
The metrics within Core Web Vitals, along with their corresponding target thresholds, allow website owners and Ecommerce merchants to determine the quality of the user experience on their site.
Criteria for Metrics Thresholds
There are three main criteria to select metrics thresholds for your website. Google defines the measurement of the thresholds into three categories: Good, Need Improvement and Poor.
High-quality User Experience
The thresholds for Core Web Vitals metrics are determined based on human perception and human–computer interaction (HCI) research, which can be expressed as a range of values rather than a single fixed threshold.
In cases where relevant research is available, the range is used to guide the threshold selection process. In cases where research is unavailable, real-world pages are evaluated to identify a threshold that results in a good user experience.
Concrete ranges for the User Experience are discussed in the 2nd blog post of this series.
Achievable Thresholds By Other Web Content
In short, this metrics is to compare your performance with "other web content". This means how other websites perform out there.
The "Good" thresholds for Core Web Vitals metrics must be achievable for existing content on the web and are based on data from the Chrome User Experience Report or CrUX (Read this article about how to use CrUX https://web.dev/chrome-ux-report/).
To confirm that a threshold is achievable, it must be met by at least 10% of origins and consistently achieved by well-optimized sites. The "Poor" threshold is set at a level that is not currently met by a minority of origins, unless there is research available to define it.
By default, the worst-performing 10-30% of origins are classified as "Poor".
Percentile Choice
To determine the overall performance of a page or website, the 75th percentile value of all visits is used. The 75th percentile was chosen because it satisfies two criteria:
- it ensures that most visits to a page or site experience target level of performance
- is less likely to be affected by outliers
Using a higher percentile, such as the 95th, would be more likely to be affected by outliers but would also ensure that a higher percentage of visits experienced the target level of performance. The 75th percentile strikes a balance between these two criteria by ensuring that most visits experience the target level of performance.

In the blog post, we discuss how to apply these metrics to LCP, FID and CLS. We also discuss and define concrete numbers to stick to each metrics.
Read other articles about entrepreneurship, ecommerce, marketplaces and technology.


