


This series of blog posts looks at Core Web Vitals. In the initial post, we discuss how to establish standards and discuss the three main key metrics (LCP, FID, CLS). In the 2nd post, we look at applying these metrics as well as set concrete numbers to it (3 seconds for Largest Contentful Paint, 100ms for First Input Delay and 0.1 for Cumulative Layout Shift).
In this post, we aim to look at tools and processes in order to measure the metrics defined.
How to Measure core Web Vitals
Evaluating and measuring Core Web vitals is crucial. As one says, if you can't measure it, you can't fix it.
First, let's look at tools that the creator of Core Web Vitals, Google, provides to merchants and site owners.
PageSeed Insights
PageSpeed Insights (https://pagespeed.web.dev/) is a simple tool that measures all three metrics: LCP, FID and CLS.
Simply enter the URL of your site and click on Analyze. PageSpeed Insights scan your site. It provides results for both mobile and desktop. It does not include LCP, FID and CLS structured as in Core Web Vitals, which is quite funny as it's Google tools analysing Google metrics. Funnily enough, it includes metrics such as FCP (First Contentful Paint), Total Blocking Time or a Speed Index.
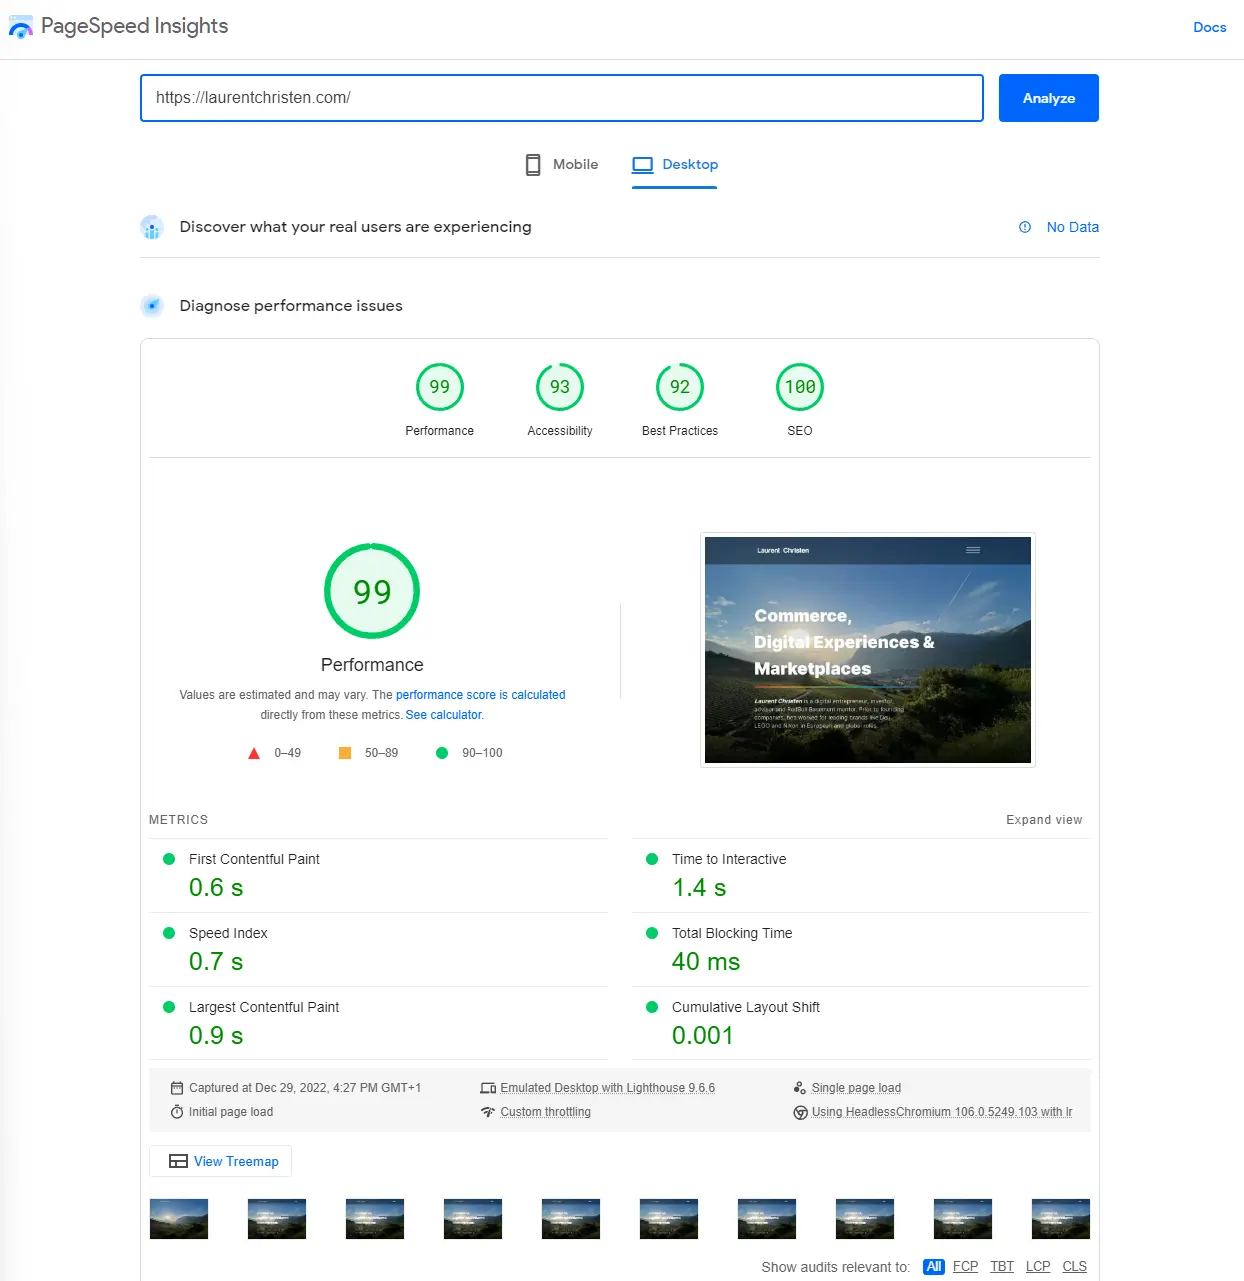
A Opportunities and Diagnostics sections lists elements that are affecting your scores. It includes estimated savings and hints on how to fix them.
Chrome UX Report
The Chrome User Experience Report or CrUX provides user experience metrics reports. Check out all details here https://developer.chrome.com/docs/crux/.
It's the official dataset of the Web Vitals program. Basically, data is collected from real browsers around the world. Data collected is analysed and then made available through a number of tools (all the tools here). It is also used by the Google Search Console.
CrUX can be accessed through:
- Big Query (https://cloud.google.com/bigquery)
- Looker Dashboard (https://cloud.google.com/looker)
- APIs (create credentials in the Google Cloud Console here https://console.cloud.google.com/apis/credentials)
The Chrome User Experience Report is the most enterprise-oriented tools that Google provides as it requires the use of their technology such as Big Query or Looker, or have an API key.
Search Console
The Google Search Console is a key tool for any webmaster or merchant. It is free and available at https://search.google.com/search-console. It helps developers, website owners, and SEO professionals understand how their site is performing on Google Search
Search console give your an overview of your site traffic. It helps push your sitemap to be indexed. Details on your site performance such as pages, queries, countries or devices. It is somehow fairly redundant with google Analytics.
Under Experience, Search Console analyses Core Web Vitals and throws in the Chrome UX report.

Lighthouse
Lighthouse is an open-source, automated tool for improving the quality of web pages. You can run Lighthouse in Chrome DevTools, from the command line, or as a Node module.
An easy way to run Lightrouse is to use Chrome as browser. Type in the URL you'd like to analyse. Right-click and hit Inspect. In the top bar, go to Lighthouse. Then click on "Analyse page load".

Lighthouse provides a similar report to what PageSpeed Insights provides but in-browser, which is handy for debugging purposes.
As you can see on my mobile experience report, I need to do a little bit of work on my performance (whereby my site runs on Webflow so some elements aren't easily fixable on platforms that provide content as a service).

Web Vitals Chrome Extension
The extension for Chrome is an easy to run when needed. Add to Chrome here.
It captures metrics similar to Lighthouse of PageSpeed Insights. These are Largest Contentful Paint, Cumulative Layout Shift, First Input Delay and Interaction To Next Paint (experimental mode).
Once installed, it displayed a simple visual view of your Core Web Vitals and if you pass the default thresholds.
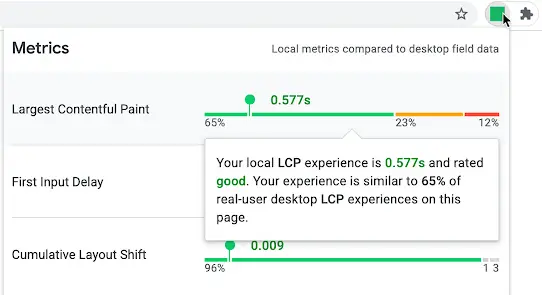
The Chrome extension is probably the best tool to quickly check improvements of your Core Web Vitals after having made changes to your site.
The final post of this series discusses concrete actions to improve your scores.


